
The Earth’s interior cannot be observed directly, but it can be investigated through the way it responds to naturally occurring electromagnetic signals. Magnetotellurics is a geophysical method that uses this response to infer how electrical conductivity varies underground.
Electrical conductivity describes how readily a material carries an electric current; in this case, the current flows through the Earth. Researchers often use its reciprocal, resistivity, to describe how strongly a material opposes the flow of current. The method treats natural electromagnetic variations as waves travelling downwards from the atmosphere. Their penetration depth depends on signal frequency and the conductivity of the underlying layers: lower-frequency signals generally probe deeper than higher-frequency ones.
As the waves pass through the Earth’s complex, energy-absorbing materials, their electric and magnetic fields weaken and shift in phase. Measuring these changes allows researchers to estimate how conductivity varies with depth. Because it is non-invasive and can be relatively inexpensive to carry out, magnetotellurics is used in Earth science and mineral exploration.
How the measurements work
As an electromagnetic wave travels downwards, its electric and magnetic fields oscillate in horizontal directions. Sensors placed shallowly beneath the surface record the two fields separately, with measurements taken along perpendicular east–west and north–south directions.
In practice, researchers also record the vertical magnetic-field component. These measurements produce time-series data across five channels, which are converted into the frequency domain using a mathematical operation called the Fourier transform. The primary quantity derived from the measurements is impedance. Researchers use it to calculate apparent resistivity and impedance phase, both of which help interpret the subsurface. Apparent resistivity indicates how resistivity varies and provides an average value for the depth investigated. Impedance phase can change sharply when a signal crosses a horizontal boundary between layers with different electrical properties.
By interpreting these measurements together, researchers can identify subsurface boundaries and infer information about the materials below ground.
Why interpreting the data can be difficult
The basic interpretation assumes that electrical conductivity changes only with depth, making it a one-dimensional (1D) problem. Real geological settings are more complicated. Conductivity can also vary horizontally, creating two- or three-dimensional structures. Under the influence of the penetrating signal, these lateral variations can generate secondary electromagnetic fields. When the structures are close to a measurement site, their effects can distort the magnetotelluric response. The distortion can affect the two perpendicular measurement directions differently, and its causes need to be considered separately.
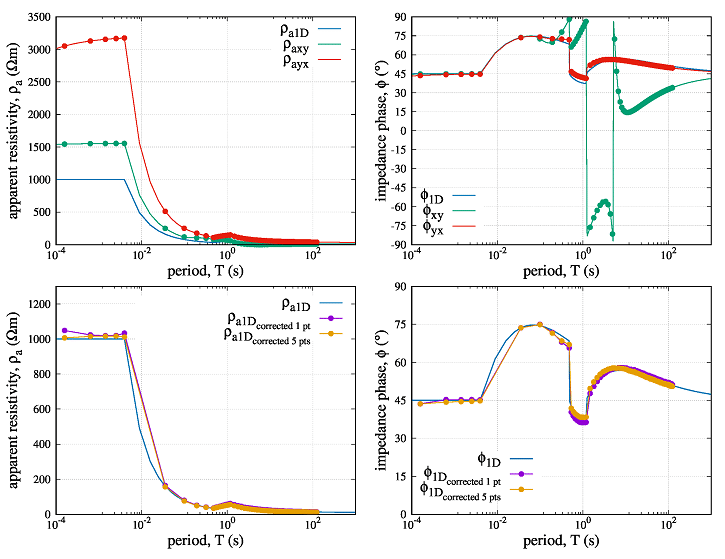
One common effect is known as “static shift”, which offsets apparent-resistivity values by an almost constant amount across a broad frequency range. It occurs when electrical charge builds up at the surface of a subsurface feature, creating a secondary electric field perpendicular to the boundary. Conductive features can also support induced currents near their boundaries. These currents generate a vertical magnetic field and an electric field parallel to the boundary. This inductive effect varies strongly with frequency and can alter the impedance phase, leading to the indication of non-existent layers. At a certain frequency, they can even reach an intensity sufficient to completely nullify the electric field in the measured direction. This results in a sharp transition of the impedance phase through the 90° value – a phenomenon whose cause had previously been unknown. Both effects may occur at the same time, making the measurements more difficult to interpret reliably.
Only a thorough understanding of the physical processes occurring beneath the surface can lead to the development of scientifically grounded diagnostics applicable to the interpretation of field data.
—Alexandra Marsenić
Understanding the physical causes of distortion
A useful way to investigate these distortions is to theoretically examine the physical processes at a vertical boundary between materials with different electrical conductivities. Such a boundary does more than mark a change in material. It can also generate and redirect electromagnetic effects.
The two types of disturbance that arise at the interface, i.e., electrostatic (Coulomb) and inductive, are linked to the primary electromagnetic field and can be described using established mathematical functions. Modelling these effects helps researchers understand how secondary fields alter the measured response.
It can also support interpretation in more complex geological settings, where each measurement direction may be affected by both processes at several boundaries with different orientations. Understanding the Earth’s subsurface also provides a window into its geological past, including major events such as Snowball Earth.
A theoretical approach to correcting the response
Existing methods for correcting distorted measurements often require additional measurements or prior knowledge of the site, and their success may depend on the analyst’s judgement and on favourable field conditions. The method described in the study titled “Correction method for magnetotelluric response exhibiting static shift” by Alexandra Marsenić instead uses a theoretical model of the primary electromagnetic field and the electrical disturbances it generates.
It works with the full spectral data describing the recorded electromagnetic field. While data on the vertical magnetic field have been merely supplementary until now, they are absolutely crucial for this method. This is because they largely eliminate the uncertainty associated with inductive distortion. For the numerical correction, the model assumes a single boundary within the uppermost layer. This simplified boundary creates an effect that combines the influence of both types of all present near-surface variations distorting the response in both measurement directions.
Its position relative to the measurement directions affects how strongly the disturbances appear in the calculated solution. The simplification reduces a general three-dimensional problem to a two-dimensional one. As a result, the corrected impedance phase values may not be fully accurate; however, the phase can still help identify boundaries between underground layers, its main diagnostic role.
So far, the correction has been applied only to the distorted response of the synthetic model – such as the one shown in Figure 1 – since field data are not currently available to the necessary extent. It is carried out in two stages. First, the method estimates the resistivity of the near-surface layer using the response at the highest frequencies. At these frequencies, the original signal is attenuated within the top layer and is less affected by deeper material changes. Its behaviour can therefore be approximated using the theoretically well-known and described homogeneous half-space model.
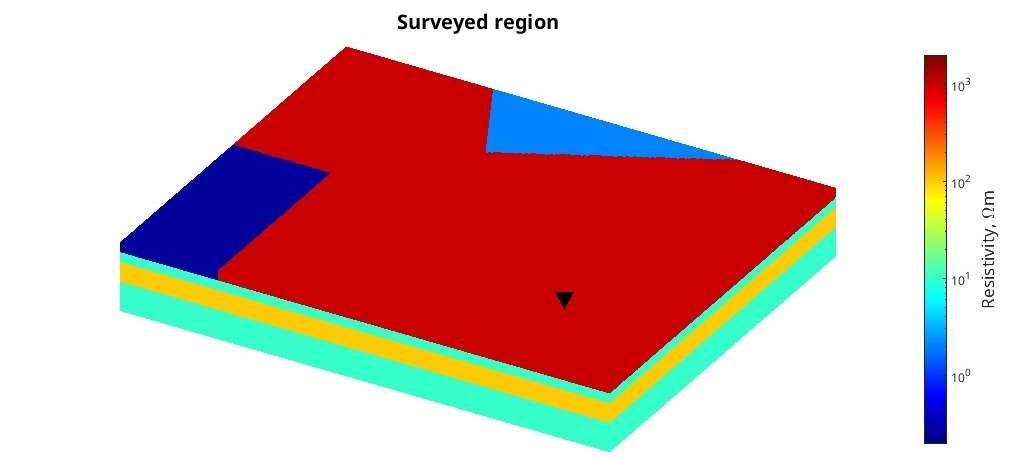
The estimate is derived using equations for the impedance of the first layer, taking into account the behaviour of both types of disturbances at high and low frequencies in a two-dimensional setting. This analysis also involves determining the location of the source of the distortion. In the second stage, the estimated values are used to calculate and remove the disturbing effects across the measured frequency spectrum. The result of correcting the distorted apparent resistivity and impedance phase for the configuration shown in Figure 1 is presented in Figure 2, alongside the undistorted 1D response.
Improving the data for better measurements
The correction method uses spectral data, a standardized format for storing magnetotelluric measurements that is not widely used because it requires more storage space. The study published in COMPEL recommends preserving these spectra rather than relying only on impedance data, which have already undergone substantial processing.
Spectral data retain information that may be lost during later processing, allowing researchers to examine the measurements in more detail. A valuable insight is, for example, that the magnetic field of the original signal is not subject to the distortion that affects only the electric field. Also, working directly with the electromagnetic quantities may reveal an inductive disturbance that could otherwise be mistaken for random noise. Removing such a signal without sufficient evidence could reduce the accuracy of the interpretation or the correction.
The method’s performance across the measured frequency range depends on how accurately it estimates the resistivity of the uppermost layer. That estimate relies on measurements at the highest frequencies, so collecting enough data in this range is particularly important.
The study therefore recommends recording data at more evaluation frequencies, especially at the upper end of the frequency range. A denser spread of frequencies can also improve investigations of deeper structures by helping researchers locate boundaries between layers more precisely. Improving the accuracy and usefulness of magnetotelluric surveys will depend not only on correction methods, but also on whether data collectors and processors preserve the information needed to apply them.
Reference
Marsenić, A. (2026). Correction method for magnetotelluric response exhibiting static shift. COMPEL-The international journal for computation and mathematics in electrical and electronic engineering, 45(6), 1246-1262. https://doi.org/10.1108/COMPEL-04-2026-0188