
For many years, market or stock price fluctuations have been assumed to follow stochastic behavior without any specific pattern. Numerous factors influence these fluctuations, such as national or international economic growth or decline, monetary policies, political issues, climate change, and investor perceptions. Individual or institutional behavior aims to maximize profit by taking trading risks; in this respect, autocatalytic (i.e., self-multiplying) behavior dominates the market. In other words, financial markets exhibit both randomness and partial order as an inseparable union. Therefore, neither random walk behavior nor collective behavior alone can dominate the market.
A recent research by Professor Güngör Gündüz, a scientist from Orta Doğu Teknik Üniversitesi (Middle East Technical University), Ankara, offers a fresh way of looking at this complexity. In his study published in the International Journal of Modern Physics C, titled “The effect of Elliott waves and Landau damping on the stability of asset pricing-A case study with the crude oil prices”, Gündüz explores how patterns from physics and mathematics may underpin the apparent chaos of financial systems.
Group behavior and Elliott waves
Partial order in the stock market emerges when a relatively large group of traders acts collectively, buying or selling a particular type of asset. Such group behavior intensifies during periods of high risk or opportunity, but it may also appear under mild market conditions. Nonlinear thermodynamics tells us that autocatalytic systems can generate oscillations similar to sinusoidal waves, thereby producing patterns.
In market dynamics, we are familiar with the so-called Elliott Wave Patterns. Traders often use these waves for forecasting, but they primarily reflect the underlying dynamics of market behavior. The basic pattern consists of five motive waves (numbered 1–5) and three corrective waves (labeled A, B, and C). These Elliott waves represent a form of order in the manifestations of collective behavior within the system. The detailed features of Elliott waves will not be discussed further in this context.
Since these waves depict collective motion, Elliott waves mirror the psychological group behavior of traders, whether they intend to sell or buy assets. However, an Elliott pattern can easily collapse depending on market conditions, particularly when random walk behavior overwhelms wave behavior. This fragility stems from the structure of Elliott waves, which are composed of Fibonacci numbers, primarily 3 and 5. Historically, Fibonacci numbers emerged from an autocatalytic system, specifically, the population growth of rabbits. The ratio of two consecutive Fibonacci numbers converges to the golden ratio approximately 1.618…
The golden ratio is the least convergent series in mathematics. Any small deviation that increases the ratio beyond 1.618… destroys the Elliott wave and thus the collective motion within the system. In other words, Elliott waves exist on a knife-edge; their structure can easily shift back to random walk behavior.
Landau damping
Group behavior naturally generates waves, thereby creating a kind of stability within the system. However, this stability is fragile and can collapse easily if we consider only stochastic processes. Yet another natural mechanism exists that enhances stability, known as Landau damping, discovered by the physicist Lev Landau.
Landau’s work in plasma physics involved nearly fixed atomic nuclei surrounded by a cloud of mobile electrons. In this analogy, the electrons that leave the atom represent active traders who frequently engage in trading, while the electrons bound to the nucleus resemble traders who rarely trade. The concept of Landau damping can be explained qualitatively using a simplified Maxwellian distribution diagram (Figure 1), even if it does not perfectly capture the full dynamics.
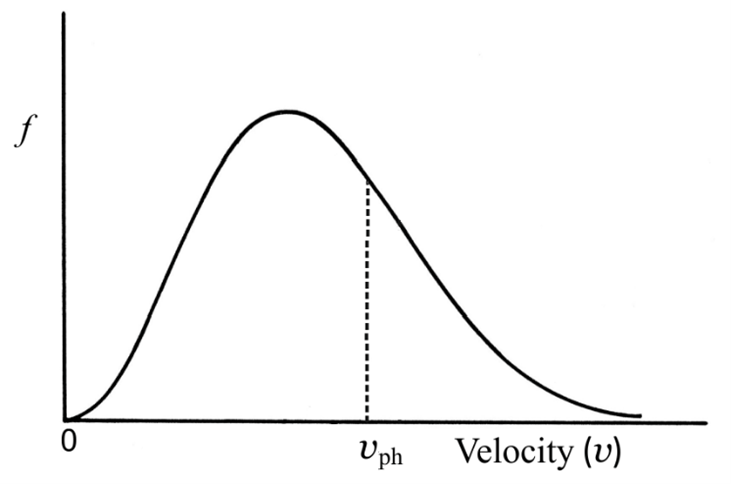
Here, f denotes the distribution function of shares, and velocity denotes the exchange velocity of shares. When the exchange velocities of certain shares approach the phase velocity of the prevailing wave, these shares accelerate to match that phase velocity. This occurs when shareholders lie slightly to the left of the dashed vertical line in Figure 1, that is, when they attempt to catch up with the group behavior.
If the dashed line is positioned to the left of the distribution peak, the opposite occurs: the number of stagnant (low-velocity) shares is smaller than that of high-velocity shares, and thus the wave amplifies. In summary, when traders lie on the left-hand side of the peak, we observe Landau growth, and when they are on the right-hand side, we observe Landau damping. The right-hand side, associated with high dynamic activity, corresponds to a stabilizing regime. Hence, Landau damping provides a stabilizing effect and partially suppresses random walk behavior.
Elliott waves in historical crude oil prices
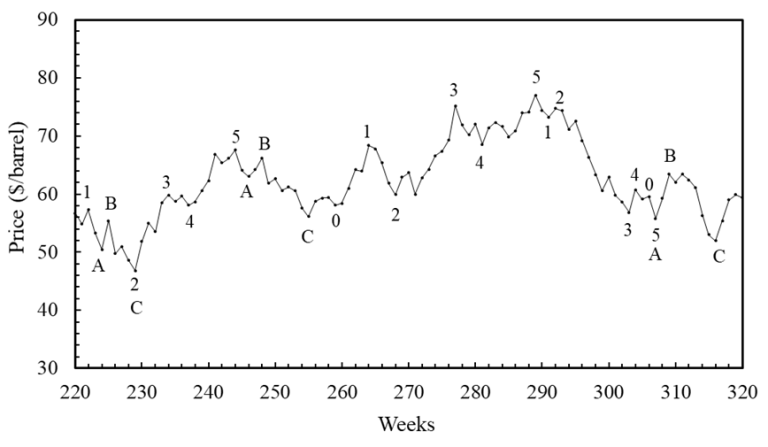
After these brief explanations, we can examine the behavior of a real market variable, the price of crude oil over time. Calculations were carried out for the period from January 1, 2001, to June 2023. Representative samples of Elliott waves are shown in Figure 2.
Over short time intervals (e.g., within a week or a month), not all traders are active. Thus, we can categorize traders into two groups: those who are actively buying or selling, and those who are reluctant to trade. The probability distributions of buying and selling become equivalent at the steady state. The reluctant traders thus display a steady-state fluctuation expressible as a cosine function.
However, this conclusion holds only at steady state, whereas the market is inherently dynamic and prices can change rapidly. Perfect steadiness is unsustainable. As mentioned earlier, the system evolves on a knife-edge, maintaining structure through Elliott waves; otherwise, it collapses into random walk behavior.
The weak stability achieved by Elliott waves depends on the shapes of the peaks in Figure 2. Whether small or large, broad or sharp, these peaks contain information about trading dynamics. The angles derived from cos(ωt), associated with the golden ratio, correspond to temporary steady-state angles. Using the cosine law, we obtain angles that are multiples of 9°, namely: 0°, 9°, 18°, 27°, 36°, 45°, 54°, 63°, 72°, 81°, 90°.
These angles can all be related, in one form or another, to the golden ratio. We may analyze the crude oil price data (January 2001–June 2023) to determine how these angles, standing like “Fibonacci angles,” are distributed in the motive and corrective waves.
Motive and corrective waves
The behavior of motive waves exhibits a fluctuating rise up to 72°, with peaks at 18°, 45°, and 72° (Figure 3). The increasing angles correspond to decreasing cosine values and hence increasing frequency (ω). The corrective waves, by contrast, rise up to 36° and then decline, undergoing oscillations (Figure 4).
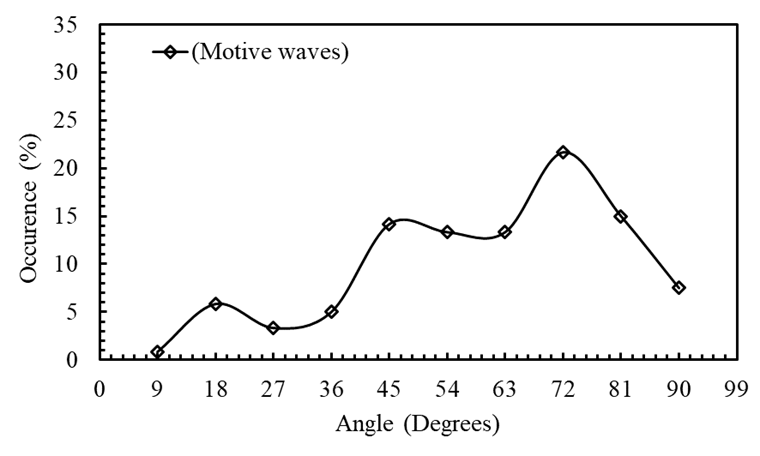
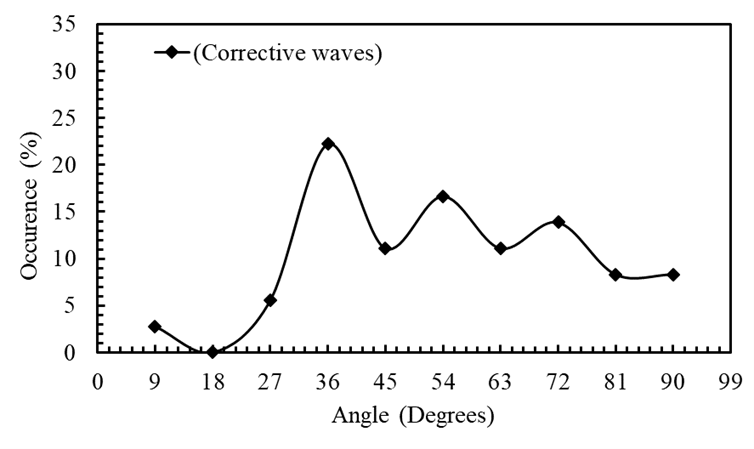
A comparison of Figures 3 and 4 indicates that corrective waves provide greater stability than motive waves. Stability is maintained during both rising and falling market trends, counteracting the tendency toward random walk behavior. Nevertheless, random walk behavior generally dominates, since the stability provided by the golden ratio remains delicate.
The 5-to-3 Rule
Note that all other angles were derived from 36°. There are three angles below it (9°, 18°, 27°) and five above it (45°, 54°, 63°, 72°, 81°). The small peaks correspond to larger angles than the steep ones. Consequently, the small-angle peaks become relatively suppressed in corrective waves beyond 36°, as seen in Fig. 4. As a result, motive waves dominate in five cases, while corrective waves dominate in three, forming the 5-to-3 rule.
As global markets continue to evolve amid uncertainty, such interdisciplinary perspectives may prove crucial. By studying the rhythms of trader behaviour through the lens of wave dynamics, researchers can better understand why markets often defy logic yet remain bound by a hidden order.
Reference
Gündüz, G. (2025). The effect of Elliott waves and Landau damping on the stability of asset pricing—A case study with the crude oil prices. International Journal of Modern Physics C, 36(05), 2550045. https://doi.org/10.1142/S0129183125500457